Purpose
In this activity, you will use graphs to investigate motion. The graphs will represent your own motion and will be drawn by the computer as you move.
Discussion
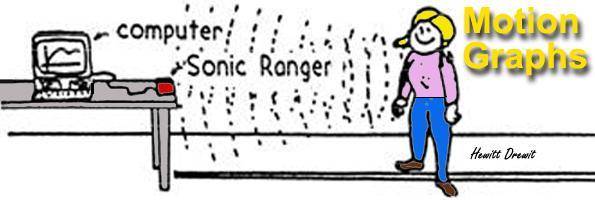
Graphs can be used to represent motion. For example, if you track the position of an object as time goes by, you can make a plot of position vs. time. In this activity, the sonic ranger will track your position and the computer will draw a position vs. time graph of your motion. The sonic ranger sends out a pulse of high frequency sound and then listens for the echo. By keeping track of how much time goes by between each pulse and corresponding echo, the ranger determines how far you are from it. (Bats use this technique to navigate in the dark.) By continually sending pulses and listening for echoes, the sonic ranger tracks your position over a period of time. This information is fed to the computer, and the software generates a position vs. time graph.
Required Equipment
Go Motion Sensor, Computer