Featured Products
Liquid Crystal Sheet Demos
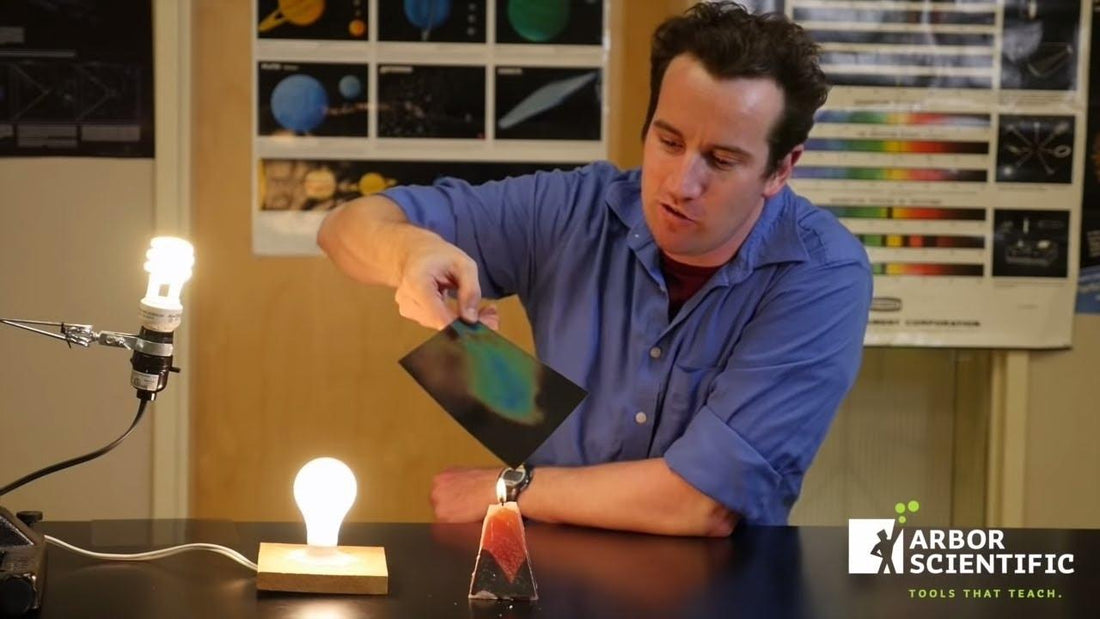
Safely demonstrating the principles and properties of heat can sometimes be a risky proposition. But it needn't be. Watch as Physics Teacher James Lincoln uses the safe, simple, and inexpensive Liquid Crystal Sheet to visually display some very cool things about heat we usually only TELL our students about.
Introduction
These Liquid Crystal Sheets are heat sensitive and offer a wide-range of possibility for experiments. Because they change color based on temperature, they can be read visually and quickly, at a distance, allowing the whole class to enjoy your demonstrations. The sheets easily warm to the touch and as they do, will display the visible spectrum ROYGBIV – with blues and purple signifying the warmest temperatures. If they get too hot, they will become dark again. The color change is caused by tiny crystal layers – on the micron scale – twisting as they warm.
The thin layer responds rapidly to the touch.
Fun and Easy Explorations
After warming a sheet with your hand, try putting some cold water or ice on it. Then, you can put some hot water on it and demonstrate evaporative cooling (blow air on the hot water and it cools rapidly). The thin design of the sheet allows for rapid color changes. Another cool thing to try is to compare the hands of male students to female students. Male hands are usually warmer because of higher blood pressure and surface area-to-volume ratios. This is plain to see using the Liquid Crystal Sheet.
A streak of warm water beautifully demonstrates the color changes.
Efficiency of Light Sources
One experiment you should conduct is to compare the heat output of various light sources. Of course the candle puts out an enormous amount of heat. This is easily tested by holding the Liquid Crystal Sheet above the light source, since heated air rises by convection. The classic incandescent light bulb is next and it puts out a medium amount of heat, because it has to heat up to glow. But the fluorescent bulbs barely put out any heat at all compared to these other sources – they are much more efficient. This topic is appropriate for Physics and Environmental Science. The more modern light sources are light-emitting diodes (LEDs), and they are the most efficient of all, putting out almost no heat. You can get one of the new, futuristic diode bulbs at your local hardware store.
Insulation and Conduction
You can demonstrate insulation using a piece of Styrofoam. Place the Styrofoam below the sheet to delay the transfer of heat to the tabletop and hold the thermal images longer. Once you have your image, use a piece of metal to demonstrate thermal conductivity. The metal takes the heat away faster. You can also demonstrate that friction generates heat when the metal is applied to the surface.
Placing the sheet on Styrofoam will lengthen the duration of the thermal image.
Thermocline
As an example of how well the sheets can display 'what's hot & what's not", I offer the thermocline. Cold water and warm water will sort themselves based on temperature due to density differences, called a thermocline. Thermoclines occur in swimming pools, lakes, and the ocean. Generally, the warm water rises and the cold water sinks. However, in the ocean there are also haloclines, which are density differences caused by salt content. This is a good chance to probe the water line and determine which color corresponds to which temperature.
Measuring the Microwave's Wavelength
In this experiment, we are going to measure the wavelength of a microwave with a ruler, a piece of Styrofoam, and the Liquid Crystal Sheets. Insert two sheets on a plate into the microwave; make sure that they do not rotate by using a tube or rack to hold the plate up, then let it cook for only a few seconds. When you take the sheets out the pattern you will see patterns in the shape of the microwaves. You can measure the wavelength of the microwave by measuring the distance between these hot spots. You will probably notice two different distances between spots. Between two close spots measure only half the wavelength (antinode to antinode distance) but when spots are far apart, it is a full wavelength (think cosine). The full wavelength is about 12 cm. Using the microwave oven's frequency (usually stamped on the back or the inside), you can calculate the speed of light. My microwave oven is 2450 MHz. Multiplying this by .12 meters, and using v = λ f gives us the speed of light: 3 x 10⁸ m/s.
Lasers
I have found that these sheets absorb heat well from red, and sometimes blue, lasers. Though I haven't thoroughly tested the effect of different colored lasers, my belief is that the red is absorbed more readily than the green, for example, and so it can be used to write messages. Awesome!
With a red laser you can write not-so-secret messages. Light waves transfer energy.
James Lincoln
Tarbut V' Torah High School
Irvine, CA, USA
James Lincoln teaches Physics in Southern California and has won several science video contests and worked on various projects in the past few years. James has consulted on TV's "The Big Bang Theory" and WebTV's "This vs. That" and the UCLA Physics Video Project.
Contact: James@PhysicsVideos.net


